What’s everyone’s favorite economic topic right now?
Inflation of course!
It’s outta control!!!
$5/gallon is insane!!!
My grocery bill is through the roof!!!
We’re still below historical averages!!!
*cue record scratch*
Wait. What?
Yup.
For all the hullabaloo, we are still BELOW long-term historical inflation rates.
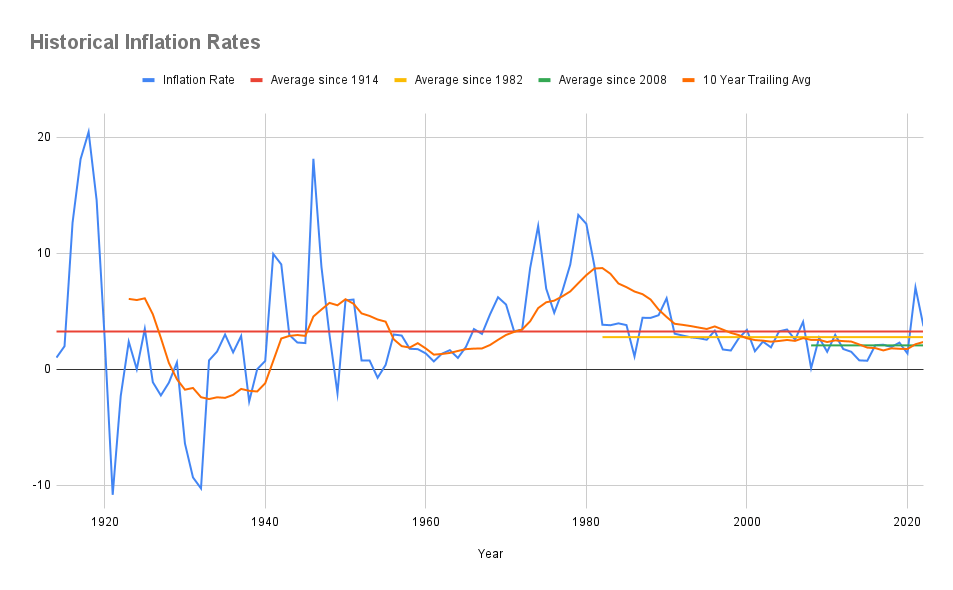
I’m a nerd, so I dug up the annual inflation rates (as measured by the Consumer Price Index) going back to 1914.
Here’s what I found:
The average over 108 years is 3.24%.
In 2021 it was 7.04%.
So Rick, how could you possibly say we’re BELOW historical inflation rates? Clearly WE ARE NOT!
Given those two data points, I’ll give it to you – we are not.
But things change when you zoom out to look at the averages.
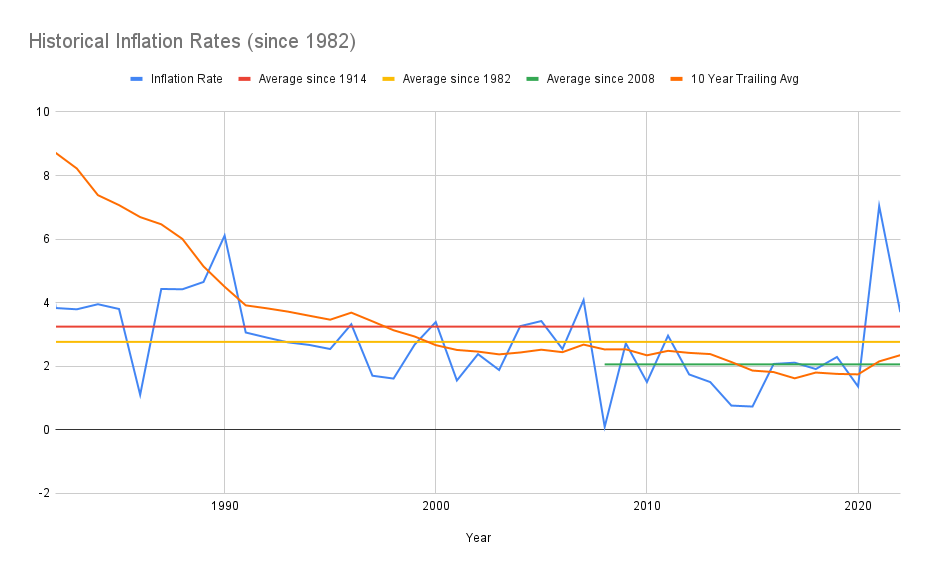
Since 2008 inflation has averaged 2.05%. Thus we are BELOW long-term inflation rates.
So why are we feeling it so much?
Inflation is called “the silent killer” because it’s normally like a frog in boiling water – you never really notice it until it’s too late.
The way the last 14 years have gone, we’re like frogs put in the freezer and THEN dropped in a scalding hot, bubbling pot of boiling water.
We went from NO inflation to HIGH inflation inside of a very short period of time.
So that’s why it stings so badly.
But believe it or not, things are still actually LESS EXPENSIVE today than they should be given historical inflation rates.
For my fellow nerds, here’s a couple charts I put together slicing and dicing the data.
Infer from it what you will, but any way you cut it we’re below long-term inflation rates.