Colors! Pretty!!!
Each colored square is an ingredient in your investment stew. If you’re a client of The Financial Zen Group, most of these ingredients are in your portfolio.
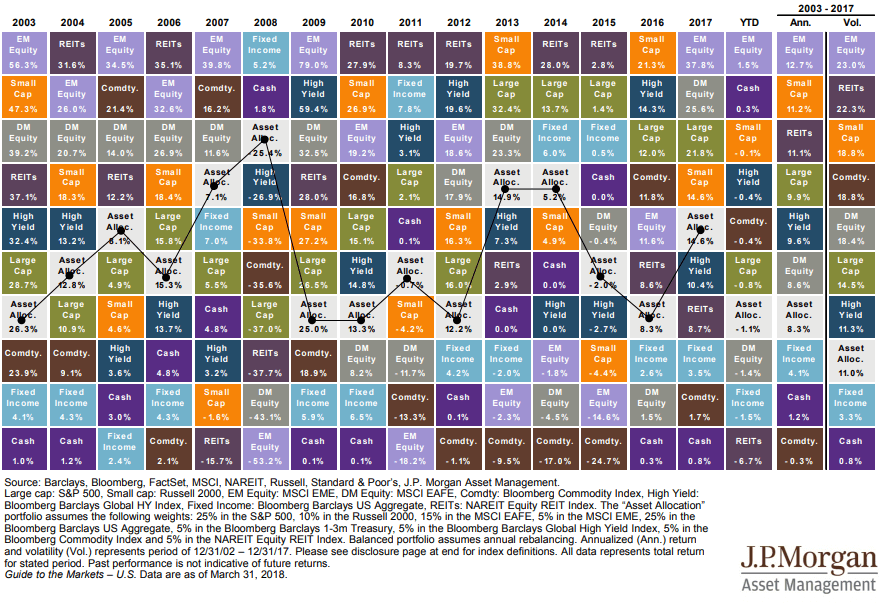
The ingredients are sorted from top to bottom. The best performing ingredients are at the top. The worst are at the bottom.
Look at the first column, for example. In 2003 “EM Equity” aka Emerging Markets was the best ingredient. It had a 56.3% return in 2003.
The worst ingredient in 2003 was cash. Cash only earned you 1%.
Make sense?
One of the many things the “Investment Quilt” teaches us is that past performance is a lousy indicator of future results. Therefore you should not “chase returns” by getting in and out of the market based on what it just did.
Follow emerging markets from year to year.
It’s either the best or the worst. And it’s usually the worst right after it was the best.
If Wall Street has fooled you into thinking market timing works, then you’ll probably invest after it was the best, just in time for it to be the worst. And then sell it after it was the worst, right before it’s the best.
In other words, buying and selling at exactly the wrong times. Studies confirm this happens consistently. The average investor gets half of the market returns because they are always buying and selling at the wrong time.
The solution? Never sell. Buy and hold and then hold some more. We know the market’s long-term return is 10%. That’s pretty darn good. Why would you mess with that?